

Home Sales are Stable with Rising Prices
The median May selling price for single-family Flagler homes was $157,000, up 15.1% from one year ago. Cash sales YTD are down 19.6%. YTD short sales down 66.7%. YTD sales of bank repossessions are up
Palm Coast, FL – June 10, 2014 – The number of single-family Flagler County homes sold through the Multiple Listing Service, both in May and year-to-date, remained essentially unchanged from one year ago, but the market’s internal dynamics are considerably changed; the most notable being the sudden decline in short sales.
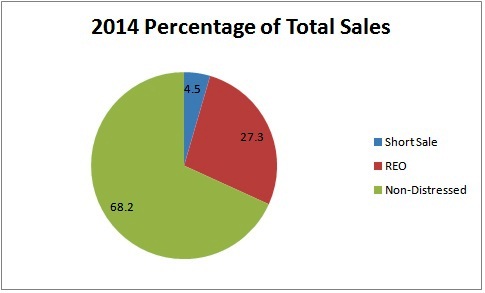
Through the first five months of 2014 short sales declined 66.7% from the same period one year ago. And none of the 34 home sales posted through the first nine days of June 2014 were short sales. As the competition for bargains heated up, it no longer makes sense for buyers or sellers to get tied up in a short sale contract Short sale contracts take longer to close and have less predictable outcomes. Once averaging nearly 50 per month, short sales are no longer a significant factor in the local market.
REO sales have increased in frequency. Through May, REO sales have increased 27.7% year-over-year. [REO stands for Real Estate Owned, the moniker used on lenders’ balance sheets to recognize properties taken by foreclosure or by a deed in lieu of foreclosure. It’s interesting that the term is used because it is efficiently short, yet requires the inclusion of a full sentence to define its meaning.]
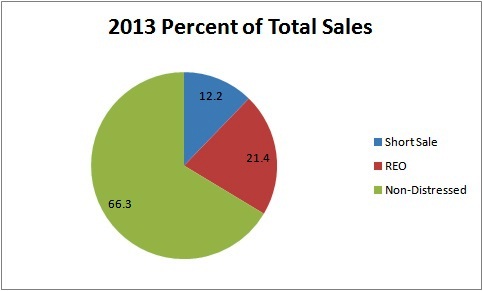
May’s median selling price for the 135 non-distressed single-family homes sold through MLS was $175,000. The 54 REO sales sold for $122,500 (median price), a 30% discount. At a median price of $116,500, the nine short sales were discounted 33.4%.
 Eighty-seven homes, or 43.9% of May home sales were “all cash” The median price for cash sales was $142,500. April/May cash sales are down 28.7% year-over-year, perhaps indicating a slowdown in investor buying.
The absorption rate for Flagler homes sits at 5.15. That means that there are slightly over five months of “for sale” inventory at today’s selling prices, signaling a mild sellers’ market.
A strong rental market is a good indicator of a robust market. Local rentals are fetching higher prices and availability is very tight. Some investors who were flipping their fixed up purchases only a year ago are now buying to hold in the rental market. Rents are strong and rising. Further value appreciation of refurbished homes is almost certain.
 Residential construction continues to expand in both the city and the county. Building permits for new homes in 2013 doubled the previous year’s count. Through May this year, new permits are 42.6% ahead of last year’s first five month’s pace.
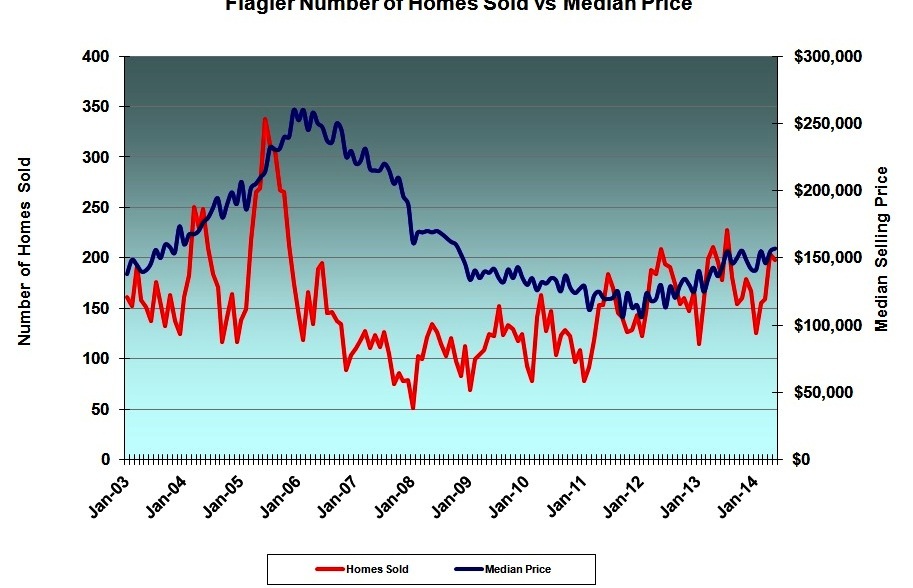
The number of homes sold goes through two cycles; annual and long term. More homes are sold in the spring and summer than in the fall and winter. That’s the annual cycle. Long term, housing cycles typically last a few years. The most recent cycle has been unprecedented. We are only now reaching sales and price levels seen in 2003/2004, before the bubble.
The graph above shows how much the turnaround in median price lags the number of homes sold; both at the peak and at the bottom. The table below puts that and other measures into perspective.
| Peak | Valley | |
|---|---|---|
| Homes Sold | June 2005 | January 2008 |
| Median Selling Price | February 2006 | January 2012 |
| % Distressed | 2012 | N/A |
| % Short Sale | 2007 | N/A |
| % REO | 2012 (or 2014) | N/A |
| Building Permits | 2005 | 2009-2011 |
| Foreclosures Filed | 2008-2009 | N/A |
| Foreclosures Completed | 2013 (or 2014) | N/A |
N/A means the valley has not yet been reached. These categories will simply fade to a small number over time; until the next cycle begins.
Leave a Reply
Want to join the discussion?Feel free to contribute!