

Cost of Constructing a Home
The study is national in scope and highlights the substantial new home land/construction cost advantages Flagler County enjoys.
PALM COAST — November 8, 2015 — The following Cost of Constructing a Home report is made available to the public as a courtesy of HousingEconomics.com. The study is national in scope and highlights the substantial new home land/construction cost advantages Flagler County enjoys.
Special Studies November 2, 2015
By Heather Taylor
NAHB Economics and Housing Policy Group
Report available to the public as a courtesy of HousingEconomics.
Introduction
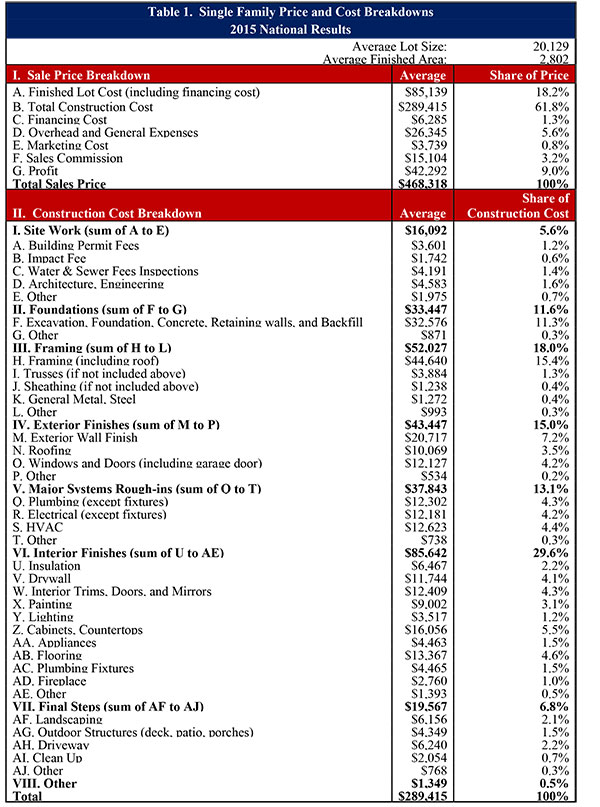
Over the years, NAHB has periodically conducted “construction cost surveys” to collect information from builders on the various components that go into the price of a typical single-family home. NAHB’s most recent construction cost survey (conducted in August of 2015) shows that, on average, 61.8 percent of the sales price goes to construction costs and 18.2 percent to the finished lot costs. On average builder profit (including owners’ salary and return on capital) accounts for 9.0 percent of the sales prices. The following sections describe the methodology of the survey and discuss the results in more detail.
Methodology
NAHB’s 2015 construction cost survey was conducted by emailing a questionnaire to a representative sample of 4,090 home builders. The sample was stratified by size of the builder (based on number of starts) and region of the country (the sample being proportional to housing starts in each of the four principal Census regions).
Over the years NAHB has modified the survey and its methodology. In 2009, the survey methodology changed to provide a better, more representative sample of single-family construction across the country. In 2013, NAHB developed a different construction cost breakdown that more closely resembles the steps which builders take when building a home. Prior to 2013, the breakdown had 29 sections. In 2013, we created eight subcategories for each of the major stages of construction, with a total of 36 sections grouped under the appropriate construction stage. The new format simplified data collection, greatly reducing the number of follow-up calls needed to clarify and verify builder responses.
Respondents were asked to provide information about the average home built by their firms during 2015. Usable responses were received from 33 builders. Table 1 shows the detailed results of the 2015 construction cost survey.
hese results are national averages; the survey sample is not large enough for a geographic breakdown. Building practices, the cost of labor, the cost of land, and to some extent the cost of the materials can vary from place to place and depend on the nature of the particular home being built. Although the survey can provide a broad idea of construction costs for an average home, it is not a perfect tool for estimating costs for a particular house. Companies that provide more specific cost estimating, usually for a fee, include RS Means and Marshall & Swift. The costs include all the costs paid by a builder that go into a particular item, including labor costs paid directly by the general contractor, the cost of hiring subcontractors, and the cost of materials however they are purchased.
Home Size and Lot
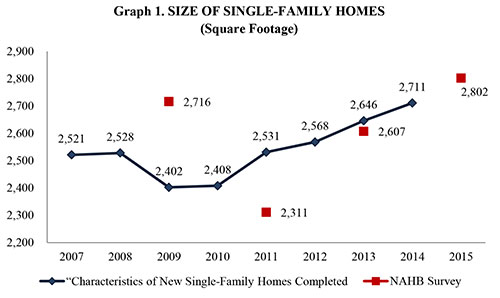
The average size of the home in the 2015 construction cost survey was 2,802 square feet. The average square feet has been steadily rising since its initial drop from 2,716 square feet in 2009 to 2,311 square feet in 2011. The Census Bureau’s “Characteristics of New Single-Family Homes Completed” contains annual data on the floor area of a single-family home. According to the Census Bureau’s annual report, the average floor area of single-family homes completed followed a pattern similar to that in the NAHB cost surveys. The average floor area peaked at 2,528 square feet in 2008, then dropped to 2,402 square feet in 2009, followed by a steady increase to 2,711 square feet in 2014 (Graph 1).
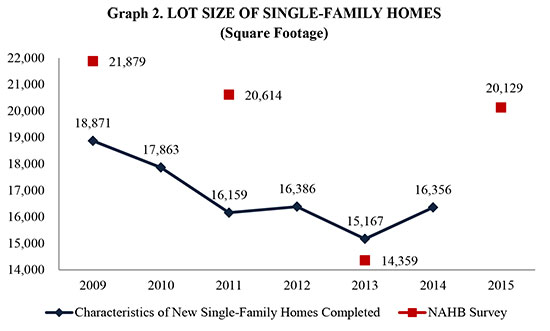
The average lot size in the 2015 construction cost survey was 20,129 square feet—about a half an acre (21,780 square feet). The average lot size, which dipped to about a third of an acre in 2013, was about half an acre in both 2009 and 2011 (21,879 square feet, and 20,614 square feet, respectively). The Census Bureau’s data on new residential construction shows that the average lot size for new homes sold was 16,386 in 2012, then dipped to 15,167 square feet in 2013, and returned to 16,356 in 2014 (Graph 2). The average lot cost per square foot in 2015 is $4.20, which is below the $5.20 per square foot it was in 2013, but higher than $3.30 per square foot in 2011 and $3.50 per square foot in 2009. Responding to special questions on the survey for theNAHB/Wells Fargo Housing Market Index (HMI) in May of 2015, 62 percent of builders reported that the supply of lots in their markets was low or very low (as reported in NAHB’s Eye on Housing blog).
Sales Price
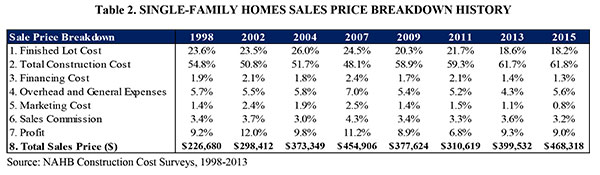
The average price of the new single-family home in the 2015 construction cost survey is $468,318, and it is the highest average since the survey was started in 1995. The average sales price has been rising over the past few years, from $310,619 in 2011 and $399,532 in 2013. According to the Census Bureau’s data on new residential construction, the sales price of new single-family homes has been steadily rising from $267,900 in 2011, to $345,800 in 2014.
Respondents were asked to breakdown the sales price of an average single-family home built by their firm into seven categories: finished lot cost; total construction cost; financing cost; overhead and general expenses; marketing costs; sales commission; and profit. Table 2 contains historical information on the sales price breakdown of a single-family home. Although the sales price rose between 2013 and 2015, the construction cost distribution is strikingly similar between the two years. The total construction cost of a home accounts for 61.8 percent of the sales price in 2015, compared to 61.7 in 2013. The finished lot accounts for 18.2 percent of the sales price in 2015, compared to 18.6 percent in 2013. In 2015, builders spent the same share of sales price on lot costs, but got a larger lot—half an acre in 2015, compared to a third of an acre in 2013.
Builder profits were 9.0 percent in 2015, compared to 9.3 percent in 2013. Although the average sales price has been rising, this reflects rising costs rather than an increased rate of profit. During the downturn many builders had to reduce operations and layoff office staff, which resulted in low overhead and general expenses. In 2015, overhead and general expenses, which was at an all-time low of 4.3 percent in 2013, rebounded to a more historically typical 5.6 percent.
The remainder of the sales price is divided between overhead sales commission (3.2 percent), financing cost (1.3 percent) and marketing cost (0.8 percent). Each of these shares is similar to the breakdown in 2013.
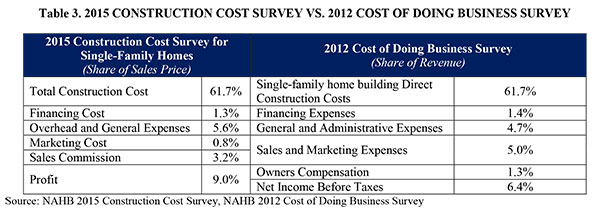
In addition to the Construction Cost survey, NAHB’s Business Management Department sponsors the Builders’ Cost of Doing Business (CODB) survey in even numbered years. The CODB is based on the income statements for a firm, rather than the price of an average house. Although the surveys are not perfectly comparable, the sales price breakdown in the Cost of Construction Survey is generally consistent with the results of the CODB. Table 3 contains the comparable parts of the Cost of Construction Survey and the Cost of Doing Business Survey. One noticeable difference is between the Cost of Construction’s profit (9.0 percent) and the sum of the CODB owner’s compensation and net income before taxes (6.4 percent). The share of profit in the sales price of a home indicates that the home was sold, whereas the net income share in the CODB takes into account homes that have both been sold and those that haven’t. Also, the profit in the construction cost survey refers to an average single- family home built by the firm; whereas the profit in the CODB survey refers to all the homes built by the firm, both sold and unsold.
Construction Cost
The average construction cost of a single-family home in the 2015 survey is $289,415. The cost of construction per square foot rose from $80 per square foot in 2011 to $95 per square foot in 2013 to $103 per square foot in 2015. This works out to an annual rate of inflation of just under 9 percent between 2011 and 2013, and a little over 4 percent between 2013 and 2015. Responding to special questions on the HMI survey in June and July of 2015, builders reported that on average, over the previous year, labor costs increased by 3.3 percent, material costs by 4.5 percent, and subcontractor costs by 5.0 percent.
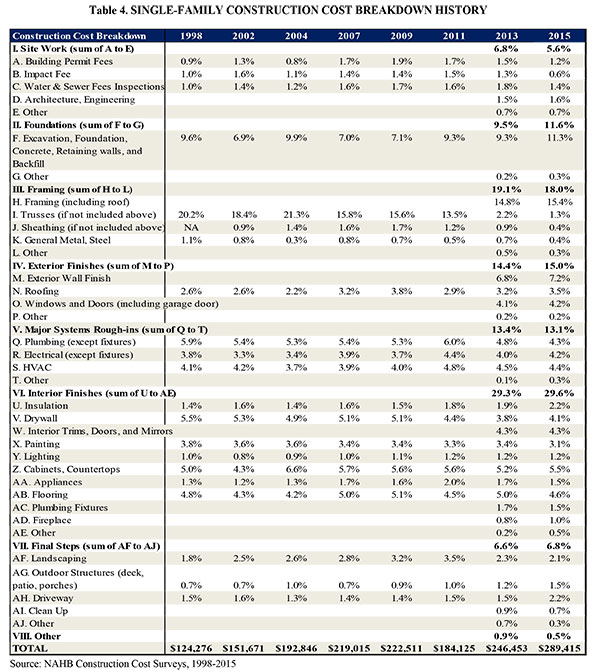
Historically, of the detailed items listed in the NAHB cost survey, framing and trusses have always accounted for the largest share of construction costs. This share remained essentially unchanged from 17.0 percent in 2013 to 16.8 percent in 2015, but is significantly higher than the 13.5 percent in 2013. The price per square foot of framing and trusses increased from $11 per square foot in 2011 [1] to $16 per square foot in 2013[2] to $17 per square foot in 2015[3]. NAHB builders have been reporting increases in the cost of lumber since 2012. Responding to special questions on the HMI in July 2015, 65 percent of builders reported that the price of trusses had increased over the last 12 months, and 60 percent reported that the price of framing lumber had increased over the last 12 months. According to the Producer Price Index (PPI) the cost of softwood lumber increased 24 percent between July 2011, and July 2015. Many NAHB builders have also had trouble finding framing crews. Responding to special questions on the HMI given in June 2015, 67 percent of builders reported a shortage of directly employed framing crews, and 73 percent report a shortage of subcontractor framing crews (see the July 3 Eye on Housing post). The share of builders reporting a shortage of framing crews (both directly employed by their firm and subcontracted) has steadily risen, from 30 and 35 percent, respectively, since June of 2012.
Over the past several years, the share of construction costs going to “excavation, foundation, concrete, retaining walls, and backfill” has been rising. In 2007 and 2009, the share was 7.0 percent and 7.1 percent, respectively, while in 2011 and 2013 it was 9.3 percent, and in 2015 the share jumped to 11.3 percent. Many NAHB builders have reported price increases in concrete products recently. According to special questions on the July 2015 HMI survey, 84 percent of builders reported an increase in the price of cement over the past 12 months, 86 percent an increase in the price of ready-mix concrete, and a 69 percent increase in the price of concrete brick and block. According to the PPI inputs to construction series, between July 2011 and July 2015, the cost of cement increased by 18 percent, and the cost of concrete products increased by 13 percent, while the cost of inputs into new residential construction materials overall only rose about 3 percent.
In addition to material costs, NAHB builders are also having trouble finding excavators. According to the HMI special questions, the share of builders reporting a shortage of excavators rose from 14 percent in June of 2012 to 37 percent in June 2015 for direct labor, and from 17 percent to 46 percent for subcontractors.
Of the 8 major stages of construction, interior finishes at 29.6 percent accounts for the largest share of construction costs, followed by framing (18.0 percent), exterior finishes (15.0 percent), major system rough-ins (13.1 percent), foundations (11.6 percent), site work (5.6 percent), final steps (6.8 percent), and other costs (0.5 percent). See Table 1 for a full breakdown.
There were major changes to the construction cost breakdown in 2013. Some of the categories either remained the same or were similar to past years. In Table 4 the previous year’s category title is captured in parentheses next to 2013’s title. If there is nothing in parentheses, the titles are identical.
[1] $24,904 average cost of framing and trusses divided by 2,311 square feet of average finished area
[2] $36,438 average cost of framing plus $5,461 average cost of trusses divided by 2,607 square feet of average finished area
[3] $44,640 average cost of framing plus $3,884 average cost of trusses divided by 2,802 square feet of average finished area
Source: National Association of Home Builders
New Palm Coast house – $ 17,000.
‘…an approach to a New City: Palm Coast…’ 1972 by Dr. J. Norman Young and Dr. Stanley Dea
Page 152
from conservationists. More than that, with long-range environmental planning and careful study by staff ecologists, the mammoth venture may not ony set an example for future would-be despoilers but come up with some urgently sought answers to pollution problems.
The Christian Science Monitor ( June 18, 1971) stated:
Water oaks, live oaks, and palm stretch along both sides of the main access road to the property. In fact, trees have to be one of the most visible items on the property. In many housing developments from one coast to the other, many sturdy old sentinels have fallen victim to the bulldozer approach to land development.
There have been many other positive reports. But while the community and media response to what we have been doing has been gratifying , reality does dictage that because of the diversity of tastes and desires, we shall receive our share of barbs. How else will it be if one does not provide Utopia/
Conclusion
Having reveiwed the technical and philosophical bases of Palm Coast, we do not feel an extended epilogue is necessary. We do not believe that the Palm Coast approach is the only way to program a major new cit in America. That there are other solutions to the new city/population enigmas is probably. But we know of no other that we can implement. We believe we have anticipated to date as much as the state of the city building art permits. Tomorrow, if we learn more we shall then anticipate more. Recently, the National Wildlife Federation issued a circular in which parallels to our own orientation are evidenced, including aspects of control of industrial pollution, recycling, and encouragement of private landowners to preserve wildlife habitats. There are two other recommendations which correspond exactly to ours, but for the fact they involve matched federal funds for sewage lant construction and tax benefits for industry to move to the countryside. Palm Coast, as presently constituted, does not need these extrinsic dollar benefit subsidies in order to accomplish the same objectives. Indeed, many have spoken of massive infusion , not economic deficit with its requisite subsidy. Today, a person can come to Palm Coast and for $ 17,000 can buy a house on a $ 3,400 homesite with immense
Page 153
availability of recreational and cultural facilities, a decent climate, and the knowledge that both physical and psychosocial pollution are being attacked and minimized through our efforts.
******************
(For the newer Palm Coasters – Levitt built here in Palm Coast in ‘ Assembly ‘ line.’…Levitt and Sons used many of the building methods they had used over the … by July of 1948, the Levitts were turning out thirty houses a day…’. I have jpegs of the first houses built this way – on Casper Drive ( named in tribute to Golf Legend William ‘ Billy ‘ Casper ). I am owner/steward of Levitts’ Jobsite #35 – Levitt ‘ Santa Rosa ‘ Model – 13 Clark Lane. I am slowly but surely restoring the ‘ African Safari ‘ design that Levitt used to stage this Model. I use ‘Steward’ because 13 Clark Lane is a official State of Florida Heritage Site. Because ‘ The Palm Coast Project was a planned future City houses were offered from a 1 bedroom / 1 bath up to 4 bedrooms/ 2 bath / 1-2 car carport or garage option including all appliances).
.